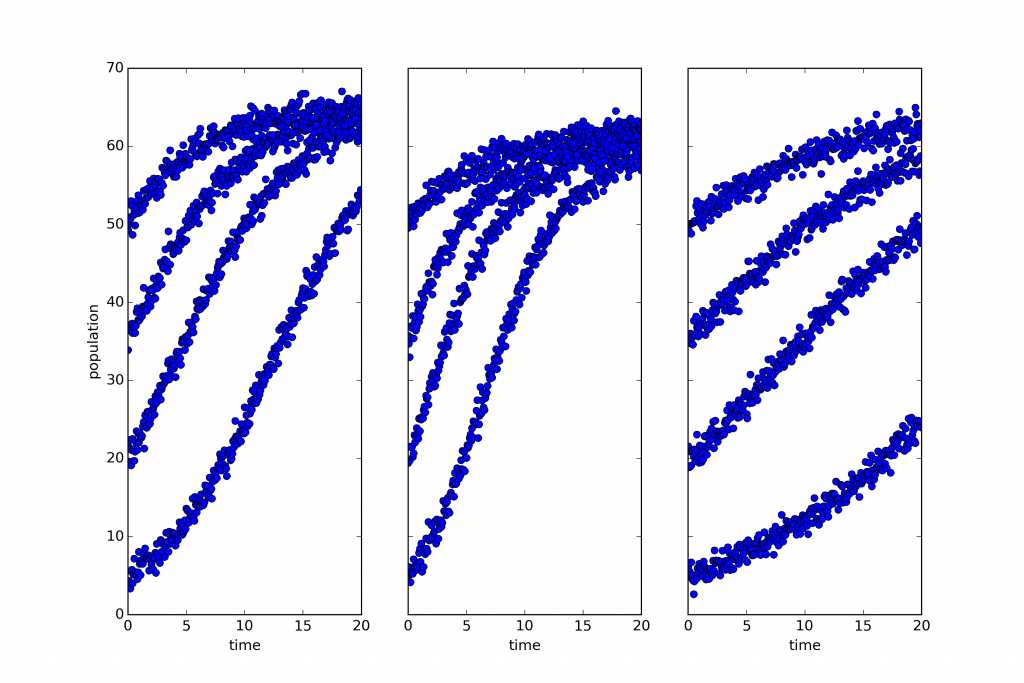
Consider the three plots below:
What you’re looking at is simulated, noisy data describing the growth of three biological populations over time (population size is shown on the vertical access with a shared scale, and time on the horizontal). One of those populations is governed by a dynamics distinct from that which governs the other two.
That last claim requires a little clarification. Roughly speaking, I mean that the way one of those systems evolves is described by a differential equation with a different form from that governing the others. A little more precisely, two of those systems share the same dynamical symmetries. A dynamical symmetry is, in this case, a change in population that commutes with its evolution through time. That is, it makes no difference whether you intervene and transform the population and then let it grow, or let it grow and then transform the population. Two and only two of these three populations share the same set of dynamical symmetries. Why is the sharing of dynamical symmetries an interesting criterion of sameness? Why are the categories or kinds picked out this way important? Because categories of this sort are ‘natural kinds’ in that they support induction — many features of one member generalize to the others (see this paper for a full discussion and careful definitions of the terms used above). I won’t give much of an argument here except to point out that lots of the most important scientific kinds are kinds of this sort: orbital systems, first-order chemical reactions, quasi-isolated mechanical systems are all kinds of this sort, and all central theoretical categories in scientific practice. If we want to do science in a new domain of phenomena, we want to identify such categories to study.
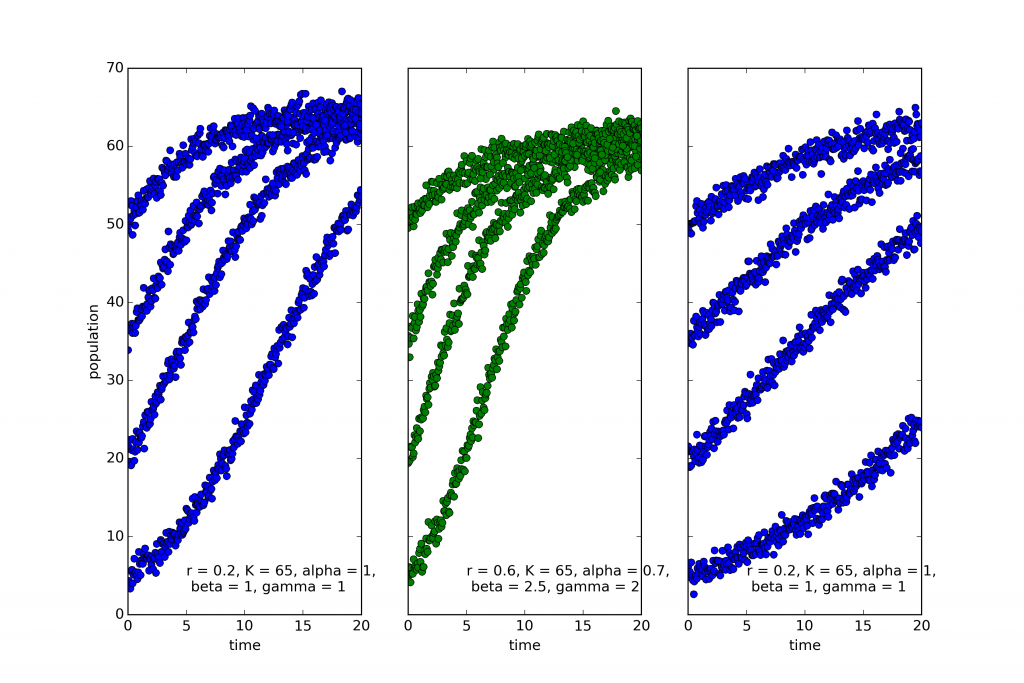
This raises an interesting question: Can we find natural kinds of this sort prior to having a theoretical understanding of a domain? Can we spot the categories directly and use them to focus the inquiry that lets us build fully predictive or explanatory theories? In answer to that question, consider the plots below:
The coloring reflects the categories chosen by EUGENE, an algorithm for automated discovery of natural kinds (see this post). EUGENE groups the first and third into the same kind. And this is in fact correct. The model used to simulate the leftmost and rightmost systems is the classic “logistic equation”:
$$\dot{x}=rx(1-\frac{x}{K})$$
The only difference is that the growth rate, r is much lower in the rightmost system.
The middle system, on the other hand, the one that EUGENE marked in green, is described by the following equation:
$$\dot{x}=rx^{0.7}(1-\left(\frac{x}{K}\right)^{2.5})^2$$
Taken together, these systems exemplify just two varieties of a large family of models of interest to biologists. They are of interest in large part because it’s so hard to tell which is correct. That is, it is remarkably difficult to determine experimentally whether a system is described by one or another set of parameters \(\alpha,\beta,\gamma\) in the general equation:
$$\dot{x}=rx^{\alpha}(1-\left(\frac{x}{K}\right)^{\beta})^{\gamma}$$
And yet, accurately and reliably, with no prior knowledge or explicit hypotheses about the governing dynamics, EUGENE can sort them one from another! I think that’s a pretty neat trick.


